Low-level Debugging on iOS using lldb

WWDC16 Session 417 offered a lot of insight into low-level iOS app debugging applicable for both Objective-C and Swift codebase. In this blog post, we will go over some of the improvements offered by new lldb features and see how you can use them for your own personal or work-related projects.
Creating Command Aliases
When you're executing a single and lengthy lldb command many times during development, it's better to create an alias for it for subsequent uses to save typing and eventually time. lldb provides an easy way to create and use an alias for frequently used commands using the following syntax,
For example, I can create an alias for breakpoint with command in lldb
(lldb) command alias br breakpoint
Next time I want to set a breakpoint in a particular file on a specific line, I can simply run,
(lldb) br set --file NetworkService.swift --line 26
Which will add and output the details of a set breakpoint in that file on that line,
Breakpoint 17: where = MyProject`MyProject.NetworkService.loadInitialQuote(for: Swift.String, completion: (Swift.Result<MyProject.InitialQuote, MyProject.QuoteLoadError>) -> ()) -> () + 45 at NetworkService.swift:26:120, address = 0x000000010862e6adYou can also set an alias with arguments. For example, if you feel its tedious to type a command like this,
(lldb) breakpoint set --file NetworkService.swift --line 26
You can modify an alias with,
(lldb) command alias br breakpoint set --file %1 --line %2
And pass arguments while running the command next time,
(lldb) br NetworkService.swift 26
Passing help Option
While creating an alias, it's also expected to provide an alias so that future developers or yourself will know what this alias exactly does without getting into implementation details.
Help details can be provided with -h flag while creating an alias,
command alias -h "Set a breakpoint in given file and on given line" -- br breakpoint set -f %1 -l %2
If you type help br now, it will show you help text along with additional text that explains additional options that can be passed to this command,
(lldb) help br
Output:
(lldb) help br
Set a breakpoint in given file and on given line
Unaliasing `alias`
Once you're done with alias and no longer need it, you can easily remove it with unalias command,
(lldb) command unalias br
Different Ways of Printing Variables and Instance Descriptions
lldb allow analyzing app variables on the fly using po and p command. The difference between po and p is that, po uses the custom description provided by debugDescription in the given class or struct.
On the other hand, p provides an instance description in built-in format provided by the system. Let's understand the difference with an example,
class House: CustomDebugStringConvertible {
    let number: Int
    let streetAddress: String

    init(number: Int, streetAddress: String) {
        self.number = number
        self.streetAddress = streetAddress
    }

    var debugDescription: String {
        return "House number is \(self.number)"
    }
}
I have a class named House which conforms to CustomDebugStringConvertible protocol and as a part of this protocol, it also implements debugDescription property where it provides a custom description for any House instance.
If I were to run this code and run po and p on House instance, it will provide two different outputs,
let house = House(number: 100, streetAddress: "Walnut Hill")

/*

(lldb) po house
House number is 100

(lldb) p house
(Practice2021.House) $R1 = 0x00007b0c00067c20 (number = 100, streetAddress = "Walnut Hill")

*/
As you can see, po has used the custom description provided in debugDescription variable, while p is using the built-in format to print the object description.
Enter the frame variable to Print Variable Description
The downside of using p and po is, they cause the side-effects in running the app code. For example, if you use them to print descriptions and they execute your source code in the process and may potentially perform non-idempotent operations. If these operations cause any other side-effects, that will be the problem for subsequent execution.
For example, if your program run is expected to execute a particular action just once, and if you run po or p commands multiple times from console, this will cause this action to execute more than once, the subsequent execution will carry the bug and result in the unexpected behavior.
frame variable specifically fixes this problem. This command does not have any code-running capability and hence doesn't cause side-effects no matter how many times it's run. The command can be used as follows,
frame variable <variable_name>
And produces the following output,
(lldb) frame variable house
(Practice2021.House) house = 0x00007b0c00067c20 (number = 100, streetAddress = "Walnut Hill")
Printing Detailed Object Description from Memory Address
During debugging, it's useful to know the object represented by the given memory address. When the crash occurs or the console throws an exception, it's only able to capture the memory address object responsible for the error. We can print the details object description from the given memory address with the following command,
In Objective-C
(lldb) po <memory_address>
In Swift
(lldb) expr -O --language objc -- <memory_address>
Reading Registers
lldb allows developers to read register values during runtime. Registers are used to hold the values of the parameters required to successfully run the app. You can pause the app execution at any point and type the following command in lldb console to read register values at that moment,
(lldb) register read
And here are my current register values,
(lldb) register read
General Purpose Registers:
       rax = 0x0000000010004005
       rbx = 0x0000000007000806
       rcx = 0x00007ff7b99a7b18
       rdx = 0x0000000000000000
       rdi = 0x00007ff7b99a7d00
       rsi = 0x0000000007000806
       rbp = 0x00007ff7b99a7b70

       .....
       ...
       ..
       .
Utilizing Register Values
Reading random register values doesn't make quite a sense - Until you know how to read them exactly at a point you need them.
When you call any method - Either in Swift or Objective-C, the system runtime internally translates that call as,
objc_msdsend($arg1, $arg2, $arg3)
Where,
$arg1 - Refers to the instance to which message is being sent
$arg2 - Refers to selector which handles the passed message
$arg3, $arg4 - Refer to sequence of arguments passed to method
When program execution is paused in the debugger, we can read these values in pseudo-registers $arg1, $arg2 etc. as follows,
register read $arg1 $arg2 (Whenever the program is paused in objc_msgsend method.)
You can use the address values provided by this command to check whether the address is valid or not.
Run memory read [arg1, arg2 or arg3] to read the memory pointed by these arguments. If this command fails with memory read failed message, then you know that memory is corrupted and can take corrective action as a follow-up.
Inspecting and Moving Around Call Stack Frames
When the program is paused in the debugger or hits the breakpoint, the backtrace is represented in terms of stack frames. The most recent frame is represented by 0 and goes on increasing towards the parents.
For example, inspect the following backtrace,
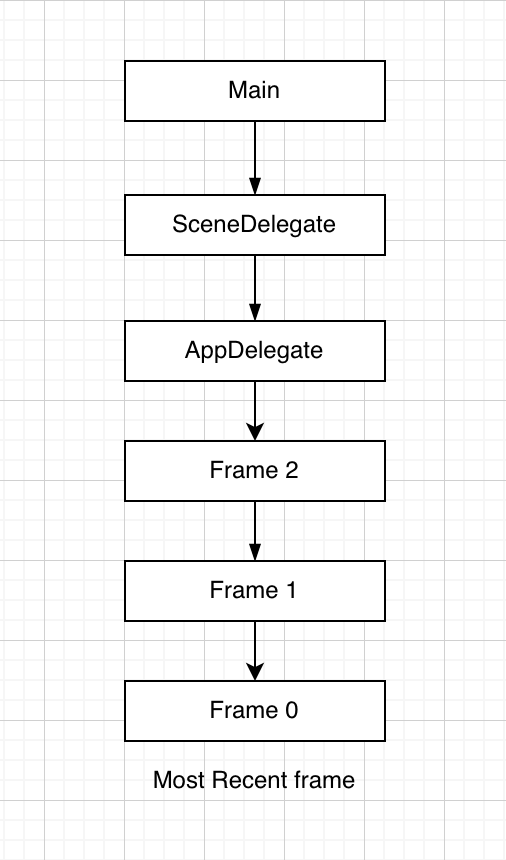
We start from the most recent frame where the program is paused. The oldest frame originates from main function which is the entry point of the app. This eventually moves into AppDelegate, SceneDelegate and eventually into our method which pauses the program flow. The latest frame is called frame 0.We can move to a specific frame in the stack using,
frame select <frame_number>
You can also move up and down in the frame stack using up and down lldb commands.
Viewing the Full Backtrace
If you want to view the full frames backtrace in one go, you can run bt command in lldb prompt to view all the frames,
(lldb) bt
* thread #1, queue = 'com.apple.main-thread', stop reason = breakpoint 9.1
  * frame #0: 0x000000010fafea16 Practice2021`ViewController.addSum(val1=100, val2=200, self=0x00007b5c0000ff80) at ViewController.swift:226:21
    frame #1: 0x000000010fafee44 Practice2021`ViewController.viewDidLoad(self=0x00007b5c0000ff80) at ViewController.swift:231:13
    frame #2: 0x000000010fb06d52 Practice2021`@objc ViewController.viewDidLoad() at <compiler-generated>:0
    frame #3: 0x00007fff24821263 UIKitCore`-[UIViewController _sendViewDidLoadWithAppearanceProxyObjectTaggingEnabled] + 88
    frame #4: 0x00007fff24825c67 UIKitCore`-[UIViewController loadViewIfRequired] + 1187
    frame #5: 0x00007fff2482606f UIKitCore`-[UIViewController view] + 27
    frame #6: 0x00007fff25019c23 UIKitCore`-[UIWindow addRootViewControllerViewIfPossible] + 313
    .....
    ...
    ..
    .
And then you can choose which stack frame you want to move to, to continue with debugging.
Applying and Triggering Breakpoints for all the Methods in a Given Class or a Module
lldb offers another cool feature that allows programs to halt in every method in a specified class or a module. This can be helpful if you are completely new to a class or a module and want to inspect the program flow by pausing at every method as the program continues.
Another cool feature is, it allows you to pass regular expression so that you can pass the pattern to force the program to stop at every function in classes that match the passed pattern,
To pause at every method in classes matching pattern,
Swift - break set -r "\.ClassName\..*"
Objective-C - break set -r "[ClassName .*]"
To pause at every method in a given module
break set -r ".*" --shlib <module_name>
Breaking at Line Matching the Passed Regular Expression
lldb is not limited to creating breakpoints by function, class, or module names. You can get even more granular by specifying which line to pause at. This is done by passing the source expression where you want lldb to pause the program.
For example, if I want lldb to pause at all locations matching return expression, I can write the following command,
break set --source-pattern-regexp "return *"
You can limit this breakpoint to a function and a file using extra options such as,
-X <class_name>::<method_name> - Limits the breakpoint to passed method
-f <file_name>.<extension> - Limits the breakpoint to passed file
Saving Breakpoints in One Place and Loading them at Each App Startup
The breakpoints set by commands above are not persisted between app runs. It's cumbersome if you have to run these commands every time the app runs. There is a better way to store these commands in a centralized place and have an automated way to run them every time the app opens.
You can store all the commands responsible for managing breakpoints in .lldbinit file stores at root location - For example at ~/.lldbinit
In order to load all these breakpoints, you can set a symbolic breakpoint at the earliest point in the app startup, preferably in the main method and add an action to load the file with lldb commands.
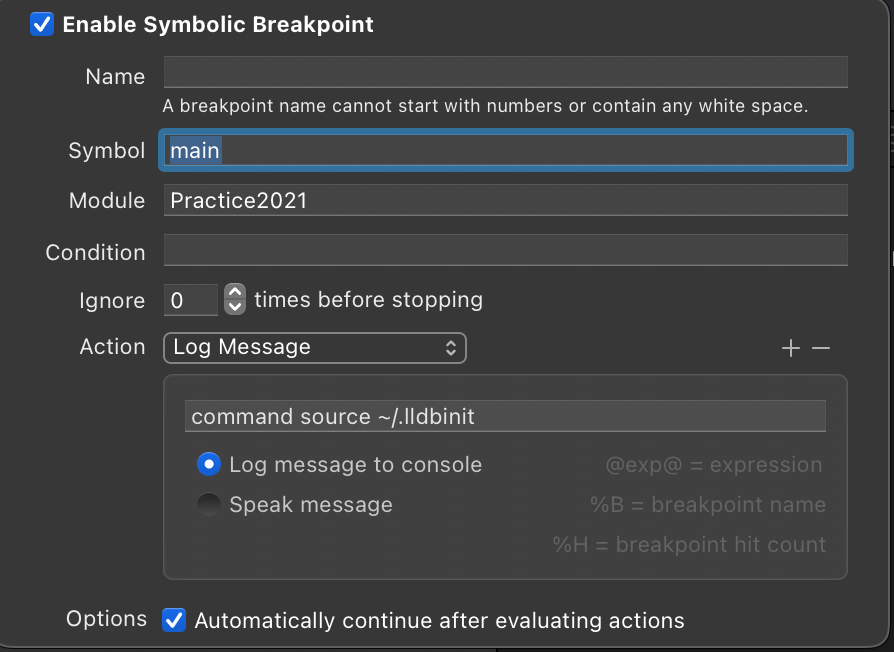
Also, check the option to log message to console to verify the correctness of breakpoint and also check automatically continue after evaluating condition so that execution won't pause
Viewing the List of Binaries Loaded in the App
Another helpful feature that lldb provides is the ability to view all the binaries loaded and running in the app after startup. You can use the following command to get all the binaries running in your app,
image list <module_name>
(lldb) image list Practice2021
[  0] 70516716-2272-3FBD-A440-9EAB6B329355 0x000000010a7af000 /Users/jayeshkawli/Library/Developer/Xcode/DerivedData/Practice2021-dgmfjrncskrpyrhhgphszdexhoqs/Build/Products/Debug-iphonesimulator/Practice2021.app/Practice2021
In my case, I am not using binaries other than those provided by Apple, so it just shows a single binary corresponding to my main app.
Summary
And that's all about overview of hidden advanced lldb features to help with easy and seamless debugging. It's possible and I hope you don't have to deal with them pretty often. There are circumstances where certain crashes or bugs only happen in production or specific builds. Reproducing and fixing them locally is another source of headache.
If you have access to dSYM file where the bug or a crash is happening, you can use this tutorial in conjunction with that file to reproduce the exact condition that caused the issue and inspect the exact state of variables when the problem occurred.
Low-level debugging is no fun by any means, but I hope this tutorial will help you fight those rare circumstances where you tried everything but are still blocked on which other ways to try.
Thank you so much for reading. If you have any comments, feedback, or concerns about this article, please let me know. If you run into follow-up questions or need help debugging your existing application, feel free to reach out on Twitter @jayeshkawli.
References: