Naive Bayes Classifier

I recently recalled one of the data mining projects we undertook in the college. Needless to say it was quite an interesting one compared to projects from other courses.
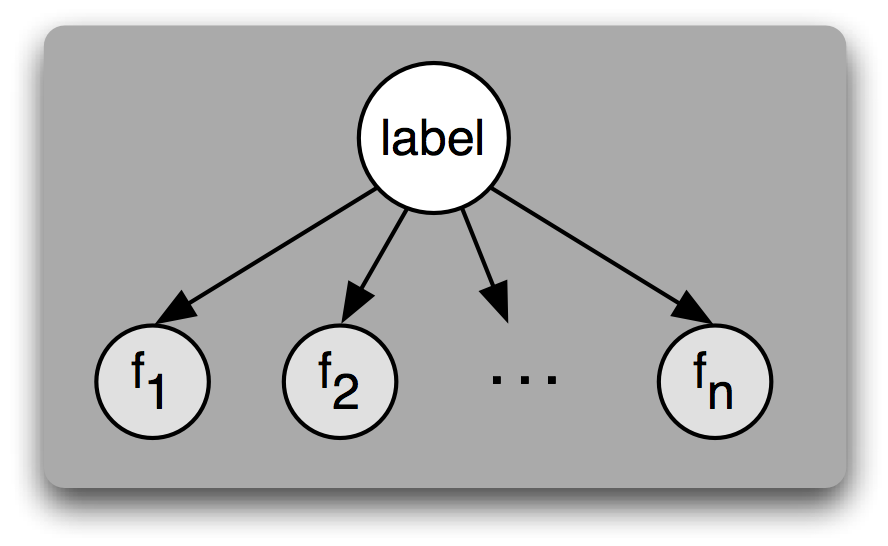
Before diving into problem statement I would give a brief account of Naive Bayes classifier and its application in the field of machine learning and data mining. For more information you can browse through Naive Bayes Classifier on Wikipedia. But in the gist, given a sufficient number of records with known attribute values it is possible to extrapolate specific attribute value of unknown records based on the model created using given data.
Basically given dataset is called as learning or training model as algorithm uses it to train itself. Using this training model algorithm classifies the unknown data. Unlike K-Means clustering this is supervised learning technique since we train the model using training dataset.
Make sure not to overfit your model since it will skew your predictions for unknown data. Do not reuse training data as an unknown dataset since algorithm will simply reuse its knowledge. Which is kind of dumb since machine learning problem will simply reduce to copy pasting.
To move to our main topic, we were given a training dataset containing fraudulent sales data. Some of the records based on their attributes were marked as fraudulent and others were genuine. We were given reasonable large dataset containing around 4,00,000 records which is good number for building reliable model. Besides, few unknown records were also provided for classification based on supervised learning from training dataset.
We wrote the classification algorithm in C++. We not only utilized model classify unknown data but also used the same model to verify existing dataset for correct classification verification.
The way we did partitioning was as follows. Say we have 100 records for example for which we already know which one are fraud and which not. We will build learning model using only 90 records and apply this model to deduce labels for remaining 10. Since we already know labels for these 10 records we can verify accuracy of our model.
Thus,
Positive predictive value (PPV) = Number of records classified correctly / Total number of records
This is what we call as supervised learning. Since we learn labelling rules from training data and then apply them to test dataset. since this is kind of approach where result on test dataset hugely depends on training dataset. If the model fits too better then we can have model over fitting problem.
Naive Bayes is an excellent classification algorithm in sense that it has got very good learning capability as evident from given example. Though, there are only 15000 training records and more than 3.7 Lakh test records.
Some of the results of this classification experiment are as follows :
When NA records were eliminated,
Total Number of input records = 401146
Total number of NA records = 14136
Total number of records with all known attribute values = 387010
Total number of training records = 15546
Total number of training records with ok label = 14347
Total number of training records with fraud label = 1199
Fraction of records with missing values = (14136)/(401146)=0.035
Thus, very small fraction of records have missing values. Thus when calculating labels for unknown records amount of missing data is not very significant. Which has also been verified experimentally in PPV calculation PPV values calculation using training records.
Total number of training records = 15732
Total number of records with NA values = 189
Effect of considering NA values in PPV calculation on training data
Average PPV value with NA records removed = 0.90772
Average PPV value with NA record values replaced by 0 = 0.904005
Hence from above analysis, it is concluded that considering or eliminating NA values in training data does not affect final value of average PPV by significant amount.
Thus from above discussion and very small value of ratio of (missing/total)=(189/15732)=0.012 (for training) and value of 0.035 (For whole data including labelled and unlabelled records) we concluded that amount of missing data is not very significant.
| Iteration | Test Partition No. | False Positives | True Positives | PPV |
|---|---|---|---|---|
| 1 | 1 | 46 | 1508 | 0.970399 |
| 2 | 2 | 80 | 1474 | 0.94852 |
| 3 | 3 | 132 | 1422 | 0.915058 |
| 4 | 4 | 174 | 1380 | 0.888031 |
| 5 | 5 | 114 | 1440 | 0.926641 |
| 6 | 6 | 207 | 1347 | 0.866795 |
| 7 | 7 | 148 | 1406 | 0.904762 |
| 8 | 8 | 195 | 1359 | 0.874517 |
| 9 | 9 | 157 | 1397 | 0.898997 |
| 10 | 10 | 188 | 1366 | 0.879022 |
Average PPV value = (Sum of all PPV values)/(Number of partitions)
Average PPV value = 9.07272/10 = 0.907272
In percentage = 90.7272%
The source code for this classification is available from my website Here. Feel free to give comment and suggestions.