Visualizing Pagerank output with D3.js

Last year I started learning D3.js library. I did some cool stuff with it. But one of the works which I am really proud of is Webpage PageRank visualization using D3.js.
As a web developer, you must be pretty acquainted with D3.js library. It's a visualization and graph library. This was also one of the most useful and easy to use graph drawing utility I ever used. (And this applies to any language, not just JavaScript).
While I was playing with it, a thought touched my mind what if visualize our PageRank project using it? Looked like quite a good idea.
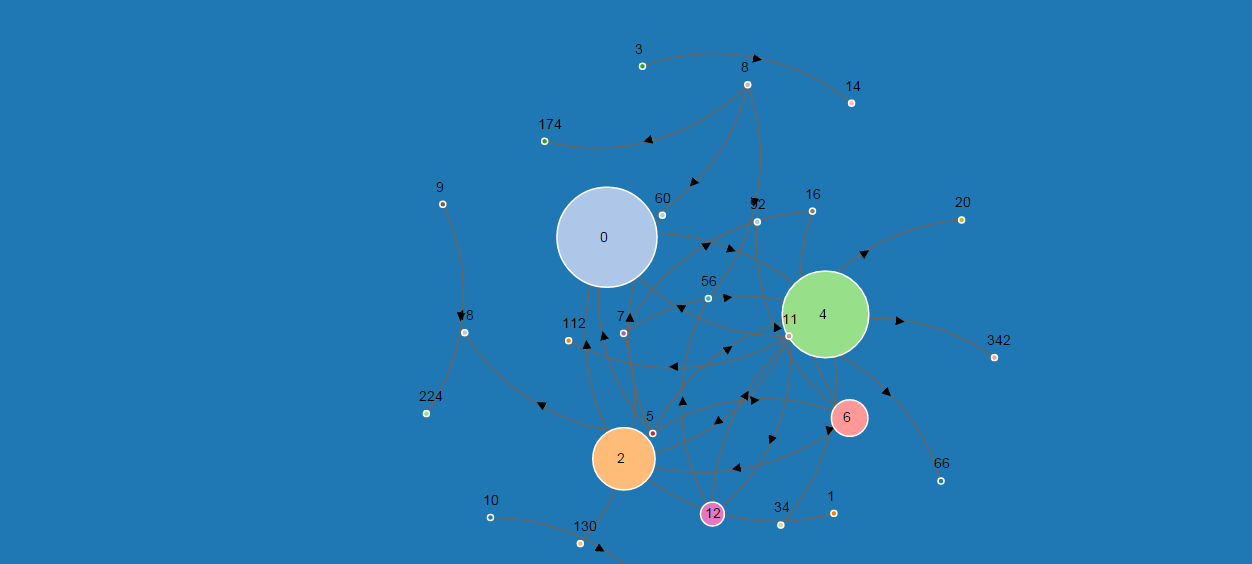
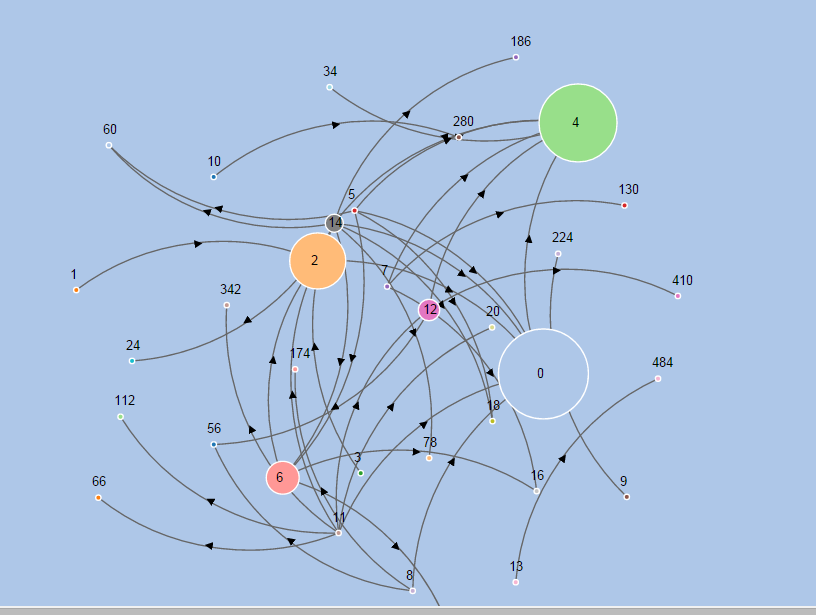
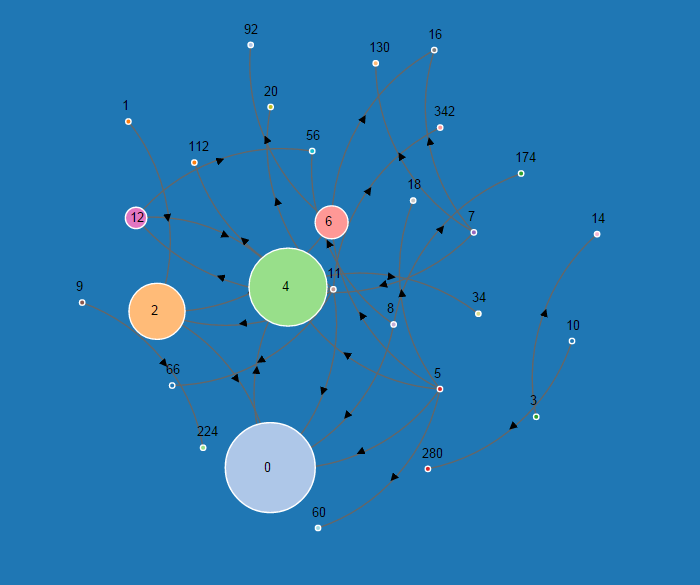
To summarize graph
- Pages are represented in the form of circular nodes
- Pagerank value of page is directly proportional to its Pagerank. More the Pagerank, larger is the node radius
- An arrow pointing from node A to B indicates page A has link to the page B
- Node receiving more incoming links tend to have higher Pagerank score while outgoing links tend to reduce the score by some margin
Here are some of the screenshots of the project,
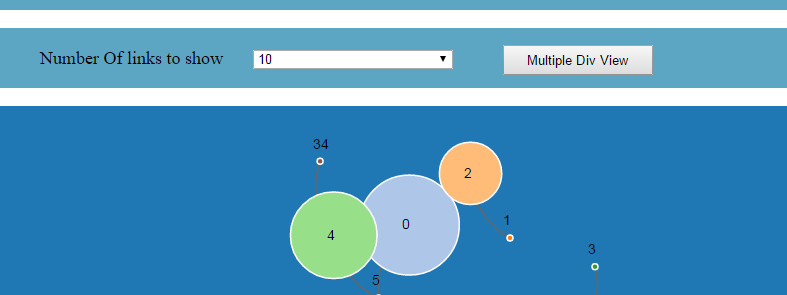
There is also a way to view multiple links simulation by allowing multiple demos to appear successively on the page
Though I have stopped working on this project for a while, I am pretty sure there are lot of areas for future improvements.
The code is hosted on Github Here
You can play with the demo by varying the Number of Links parameter Here
I would love to hear what do you think about this project!