Xcode 13 - Create a Symbolic Breakpoint on Method Name


To improve the workflow and productivity, we need to integrate efficiency into our work stream. Efficiency can either be created with its own tooling or using third-party APIs and improvements. In today's blog post, I am going to talk about new efficiency improvements in Xcode 13 in the form of symbolic breakpoints to pause at the specified method.
When you're debugging a large codebase, it is not always clear where you need to stop on the breakpoint or even if that's the only place to stop. For example, you need to stop and inspect a specific method call to inspect parameters before that method is executed. However, it's not always easy for many reasons,
- You don't know the exact method name
- The method might have been overridden by many subclasses and it's cumbersome to apply breakpoints to all of them. Even if you do, there is always a possibility that you might miss some calls
- The method is situated in a third-party library or a system framework to which you don't have direct access to set a breakpoint
Meet Symbolic Breakpoint to Break on Specific Method Call in Xcode 13
Xcode 13 offers a new way to make a symbolic breakpoint that stops the execution when the method with a specific name is called. You can set it once and no matter who calls it or from where it is called, it stops the execution at that point so that you can inspect the local state before proceeding further.
Here is a step-by-step process on how to create a symbolic breakpoint on the method name
- Select a Breakpoint Navigator tab in the Xcode
- Click
+button - Choose
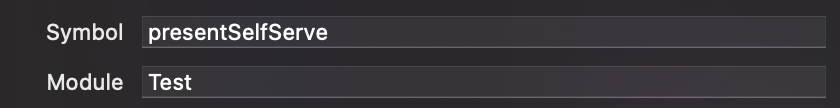
Symbolic Breakpointoption - Enter the name of the desired method you want to break on next to the
Symboltitle - Press outside of the dialogue box to save the changes and dismiss the dialogue box
Here is the demo of how to add a symbolic breakpoint to stop the execution when the presentSelfServe method is called.
Limiting Method Calls to a Specific Module
Things can get messy if the app uses multiple libraries and some of them have the same method name as the one you want to add a breakpoint on. In that case, you can limit the symbolic breakpoint to stop the execution only when the method in the given module is called, otherwise, the execution will continue as usual.
In case this method exists in multiple modules, I only want to stop the execution when the method in Test module is called so I will specify the module name Test next to the module option while creating a symbolic breakpoint.
Stopping at a Symbolic Method Breakpoint
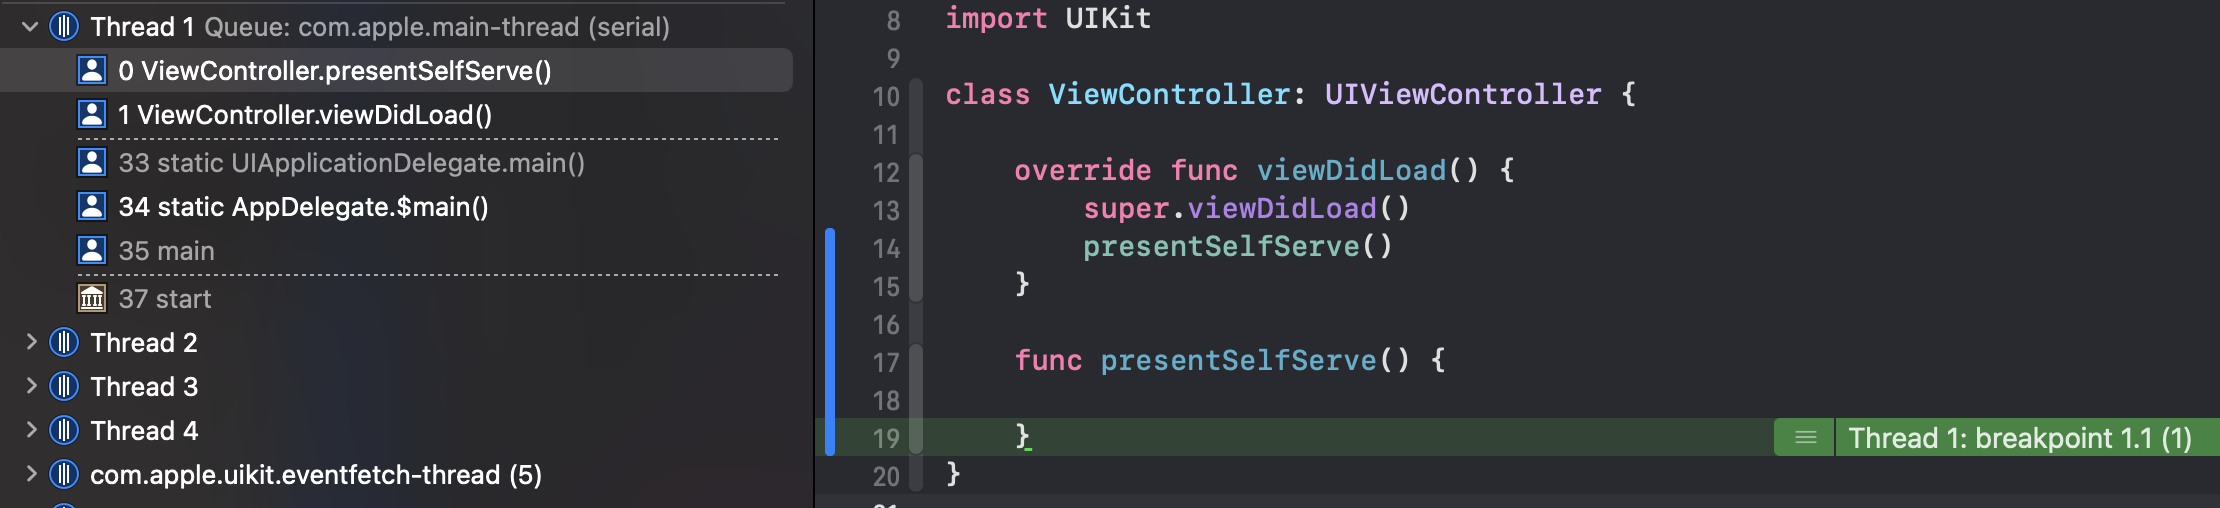
Next time when I run the app, no matter who is calling this method and how many times it is called, due to a set symbolic breakpoint, the program execution will stop as soon as the method presentSelfServe from Test module is called from anywhere.
What if my Symbolic Breakpoint isn't Getting Registered?
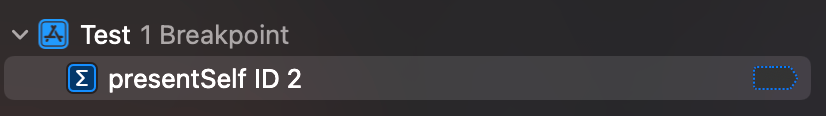
There is a chance that a set symbolic breakpoint to break on the method call won't be registered. In those cases, instead of showing solid blue color next to the breakpoint, Xcode will show the disabled breakpoint symbol which is an indication that Xcode won't pause at that breakpoint since it hasn't been resolved to any location in the loaded app. (Including all its libraries)
For example, if I change the name of the symbol from presentSelfServe to presentSelf, the breakpoint will be shown with a disabled state next to it.
Breakpoints may not be resolved for many reasons. Some common reasons are,
- The symbol name (Method name for example) is spelled incorrectly
- The symbol does not exist in the given library
- The library for the symbol hasn't been loaded
Fixing Typo in the Symbol Name
If you made a mistake in spelling a symbol name while creating a symbolic breakpoint, it is easy to correct the typo. The easiest trick is to take the typo'ed symbol name and search in the module to find all the symbols closely matching it and use them correctly.
We will use the following command to find all the symbols in a given module which match the typo'ed symbol name. Let's apply it to presentSelf method to find all the matching symbol names.
image lookup -rn presentSelf Test
image refers to the module and we use lookup to perform symbol name lookup in the module. The additional flags -rn refer to regular expression and symbol name respectively. Next, we provide the name of the symbol to find matching entries and limit our search only to Test module.
If no module is specified, it will perform the search in all associated libraries and modules. If I run this command now in the Test module, it will provide the list of all the symbol (Method) names matching presentSelf.
(lldb) image lookup -rn presentSelf Test
1 match found in /Users/jkamlakarkawli@tripactions.com/Library/Developer/Xcode/DerivedData/Test-awenjucbpbrywncaftanmbbjvhez/Build/Products/Debug-iphonesimulator/Test.app/Test:
        Address: Test[0x0000000100003e98] (Test.__TEXT.__text + 212)
        Summary: Test`Test.ViewController.presentSelfServe() -> () at ViewController.swift:17
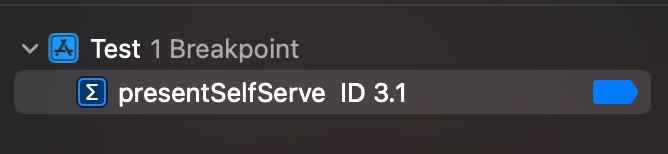
Now that we have the correct symbol name presentSelfServe in Test module, we will replace presentSelf with it and see that the breakpoint is re-enabled in the left-side pane.
Summary
Breakpoints are an important tool for debugging. The new tips and tricks in debugging act to improve the efficiency and velocity of the development cycle and help teams move faster by leveraging them. It's a welcome change to see these new breakpoint enhancements in Xcode 13.
The examples in this post may seem simplistic, but if you apply these principles in the real-world, large, and production-grade codebase, the benefits will multiply several times and exponentially improve your efficiency and debugging effectiveness.
I hope you liked today's blog post. If you have further comments about breakpoints, newer debugging enhancements, or feedback about this article, feel free to reach out to me on Twitter @jayeshkawli.
References: